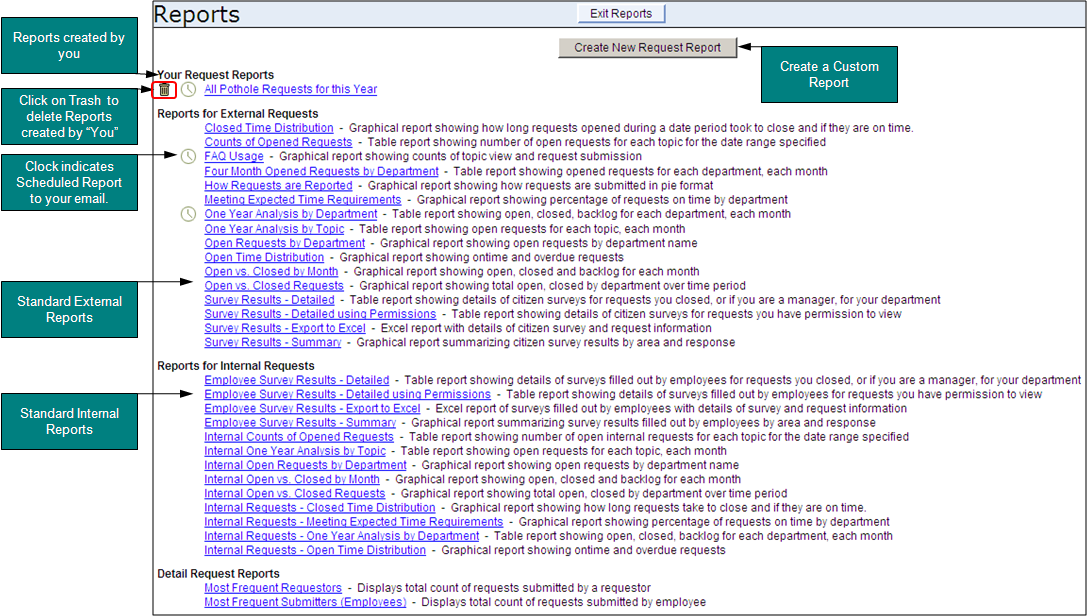
Figure 43 - Reports Screen
The Reports section is a very useful tool to obtain and measure information about the requests in the system. Several types of reports are provided as bar graphs and charts. To view these reports, select the “Report” button at the top at the Request Log Screen. The Reports screen will list reports available to view into two or more categories: Reports for External Requests, Reports for Internal Requests, and Detail Request Reports etc… (See Figure 43). When you create your own custom reports, a list of Your Request Reports will appear at the top on the main report screen. An “Exit Reports” button will also be displayed at the top of the reports screen. If your agency has the Code Enforcement module and you have code enforcement permissions, an additional tab will be available titled, “Code Enforcement Reports”.
Figure 43 - Reports Screen
To run a standard report, select a report from the list shown in Figure 43. The report will run immediately and display current results if there is data in the system (See Figure 44). The results screen will contain Command Buttons at the top for manipulating the report. You may Select a Different Report, Exit Reports, Save/Schedule this report, Export the Data to an Excel file, or Print the report. Depending on the report selected, there may be different command buttons displayed.
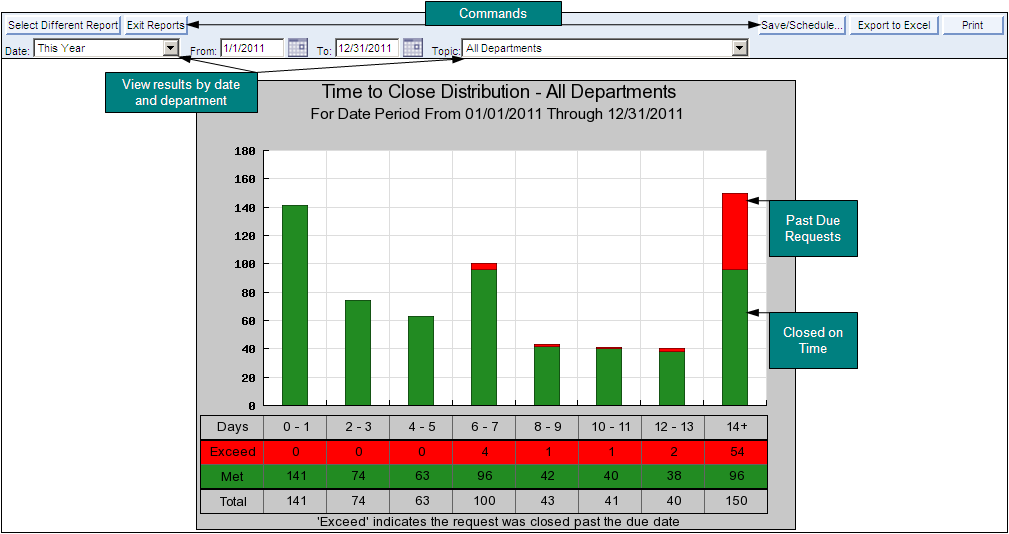
Figure 44 - Example Standard Report: Open Requests by Department
A Detailed description of the Commands are provided below:
The Save/Schedule Report button is displayed at the top of any report and it will allow you to Save and/or Email a report to yourself (Figure 44).
To save a report:
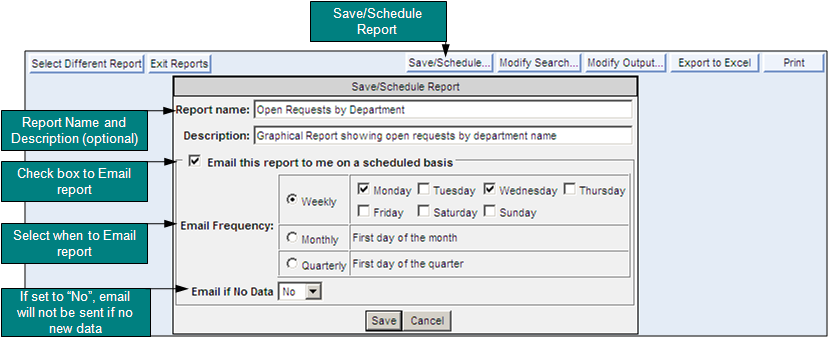
Figure 45 - Save/Schedule Reports
Custom reports can be created by querying the system to search for requests. The results from the search can be displayed in a few different formats, such as a Yahoo Map or a single list of requests. To create a report, click on the Create New Request Report button on the Main Report screen (See Figure 46). The following screen will display shown in Figure 47. Continue following the instructions below Figure 47.
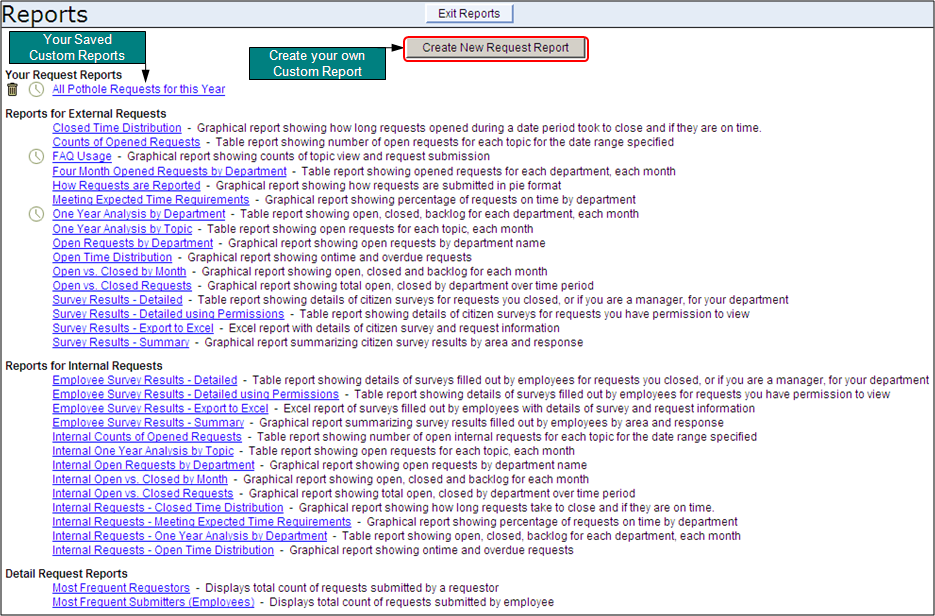
Figure 46 - Main Reports Screen: Creating a Custom Report
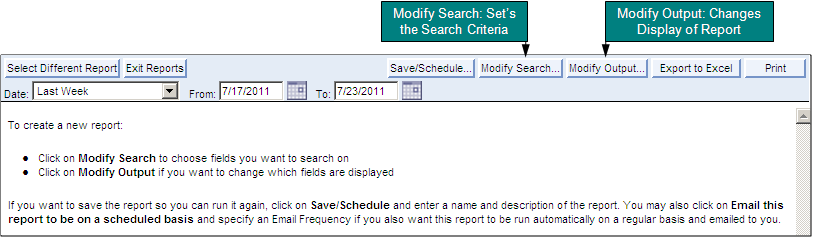
Figure 47 - Create New Request Report
There are two additional buttons Modify Search and Modify Output that appear at the top of the “Create your own report” screen (Figure 47). These commands are described below.
The Modify Search button searches on any field found on the Request Screen, such as an Open Status, phone number, address etc...To start your search, select the "Modify Search" button (Figure 47). This will display a dialog box (See Figure 48). Start selecting Search Criteria, from the field options. This will display and activate an additional menu on the right to define your search criteria further (See Figure 49). You may select multiple fields at once by holding the CTRL key down on your keyboard.
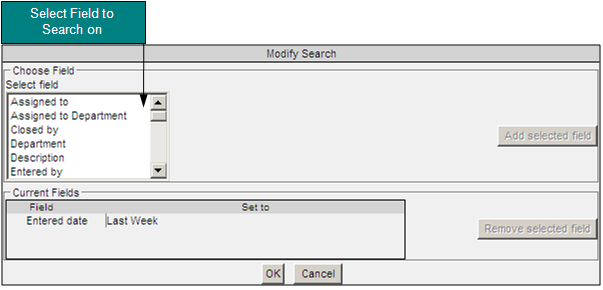
Figure 48 - Modify Search Dialog Box
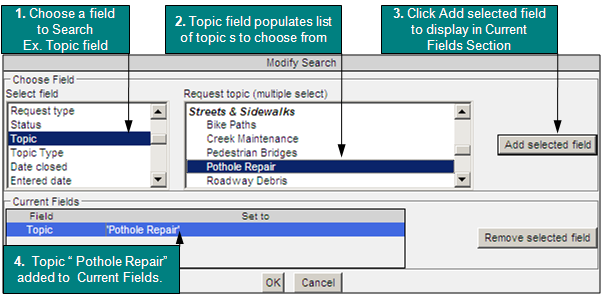
Figure 49 - Adding One Field to Modify Search
The Modify Output changes the display of the report. For example, you may select additional fields to display on the report, such as the "Entered Date," "Phone Number," "Reason Closed Description" etc...or you may plot the location of each request onto a Yahoo Map. Select an option from the "Output Template" menu. Figure 51 is set to a One Line Summary, which means the system will display each request in one line.
Other display options using the Modify Output are:
Yahoo Map – Request Location: Requests with a location will display on a Yahoo Map. These are especially useful for viewing the location of graffiti requests or potholes within the agency and various other topics (See Figure 56).
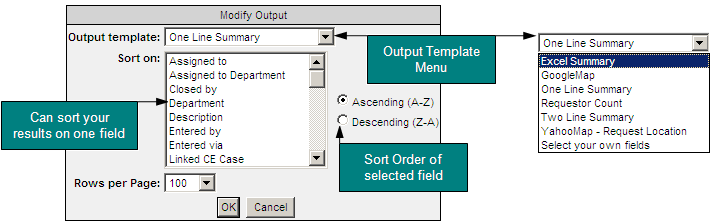
Figure 50 - Modify Output Screen
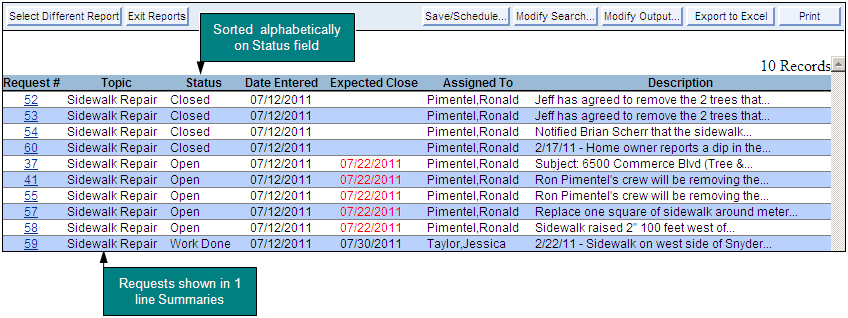
Figure 51 - One Line Summary Request Output
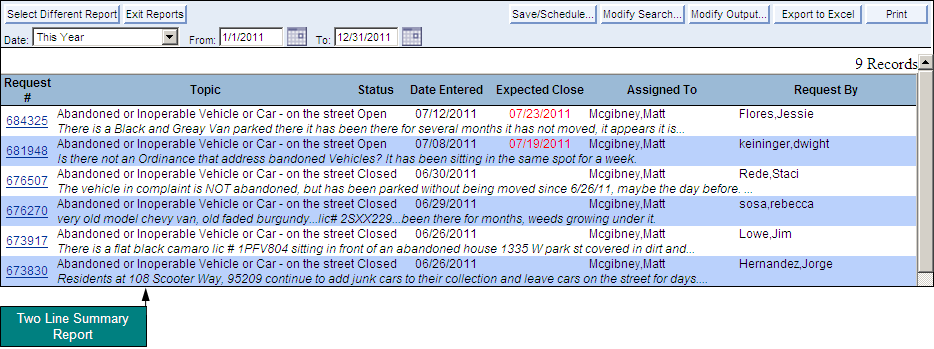
Figure 52 - Two Line Summary Request Output
After defining your search criteria using the Modify Search tool, you may view your requests by address location on a Yahoo or Google Map. Select the Modify Output button (shown in Figure 50). Select the Output template menu, and choose Yahoo Map (See Figure 53 below).
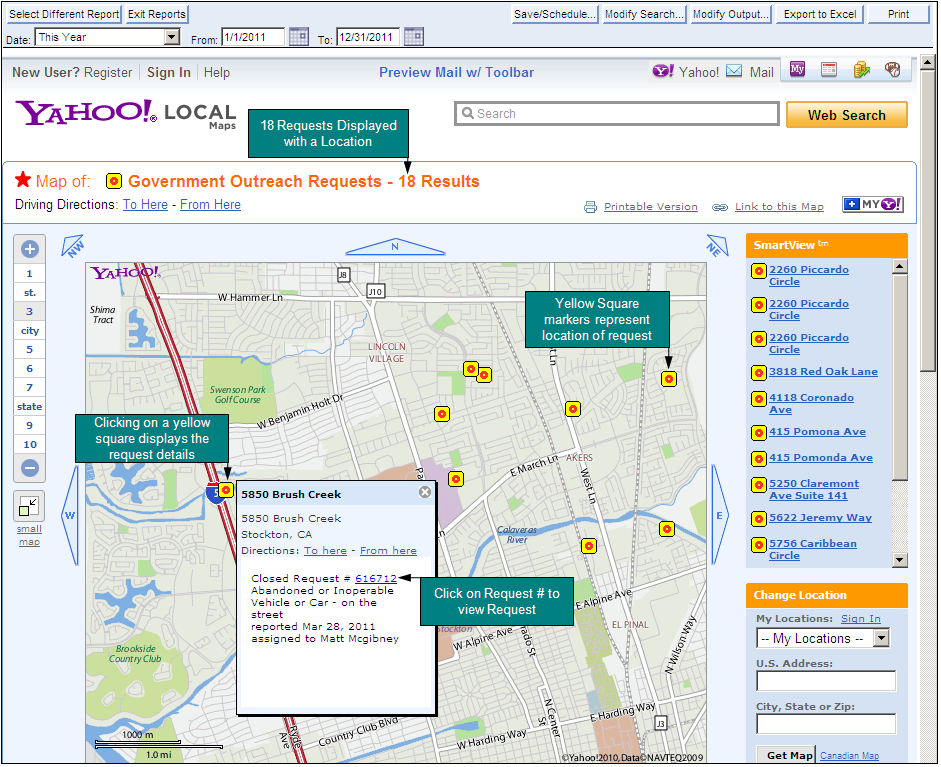
Figure 53 - Yahoo Map Report: Creating Your Own Report
Initially when a custom report is displayed on the screen, the same standard default fields are displayed. These include, the Request #, Topic, Status, Date Entered, Expected Closed Date, Assigned to, and the Request Description. Additional fields can be displayed by using the Modify Output such as the request address location, or the closed description. See Figures 55 & 56 to select and display additional fields.
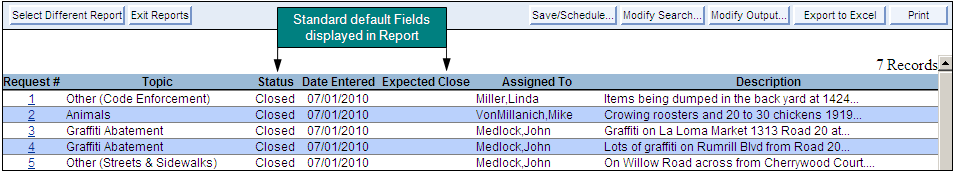
Figure 54 - Default Output field Headings Displayed in Report
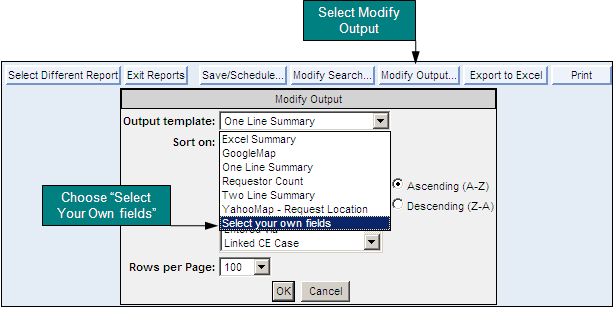
Figure 55 - Modify Output: Display Your Own Fields
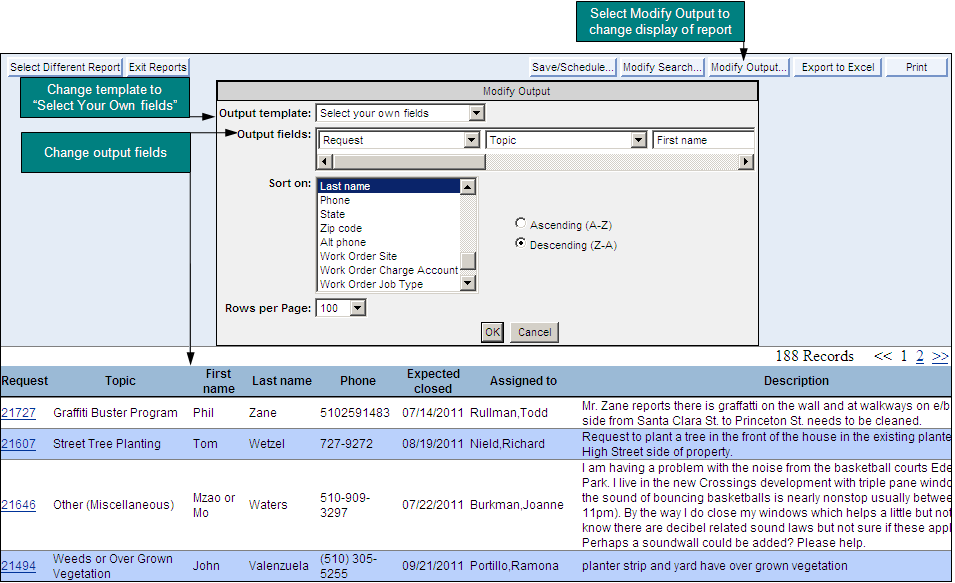
Figure 56 - Modify Output: Selecting Your Own Fields